Backtesting
Does Your Strategy Actually Hold Up Against Historical Data?
Lumverro's Backtesting module runs your rules against real market history and tells you exactly which conditions passed, which failed, and why.

Backtesting
Lumverro's Backtesting module runs your rules against real market history and tells you exactly which conditions passed, which failed, and why.
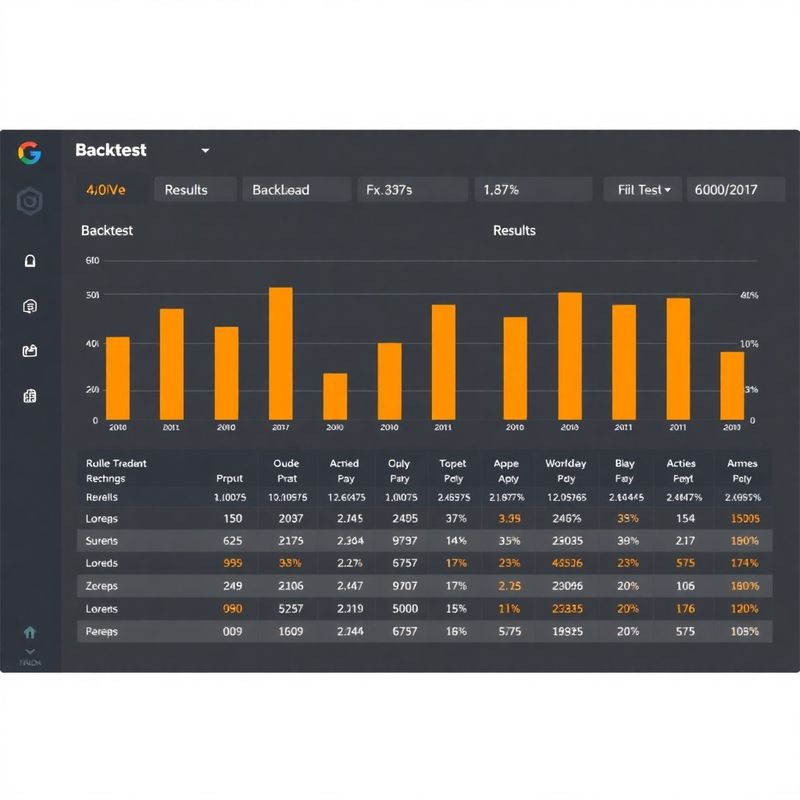
A single profit-and-loss curve tells you whether a strategy made money over a period — but it does not tell you which rules drove that outcome, which were neutral, and which actively detracted. Lumverro's backtesting engine produces a per-rule breakdown: for each condition in your strategy, you see how many times it fired, how many of those fires led to winning exits, and how many led to losing ones. This granularity lets you isolate the components of your strategy that are genuinely predictive from those that are adding noise, so revisions are targeted rather than speculative.
Set the parameters that match your real trading environment as closely as possible.
Run backtests over any date range for which historical data is available — including multiple separate windows to test for seasonal consistency across different market regimes.
Specify realistic slippage assumptions and commission schedules per instrument so that backtest results reflect the actual cost of execution at your broker, not idealised fills.
Each condition in your strategy receives its own statistics block: fire rate, win rate conditional on firing, contribution to total drawdown, and average holding time when triggered.
Receive the full backtest output as a structured PDF and a CSV data file you can import into your own spreadsheet or analysis environment for further review.
Backtesting is a diagnostic tool, not a performance guarantee. Historical results do not predict future market behaviour, and a strategy that performed well over a five-year window may not perform the same way when market structure changes. Lumverro's reports are designed to make these limitations explicit: each report includes a data-quality section noting any gaps or anomalies in the historical dataset used, and a methodology note explaining how slippage and fills were modelled. We believe you should understand not just the numbers but how those numbers were produced.
Submit your strategy rules and preferred date range to receive a backtest scope and timeline estimate.